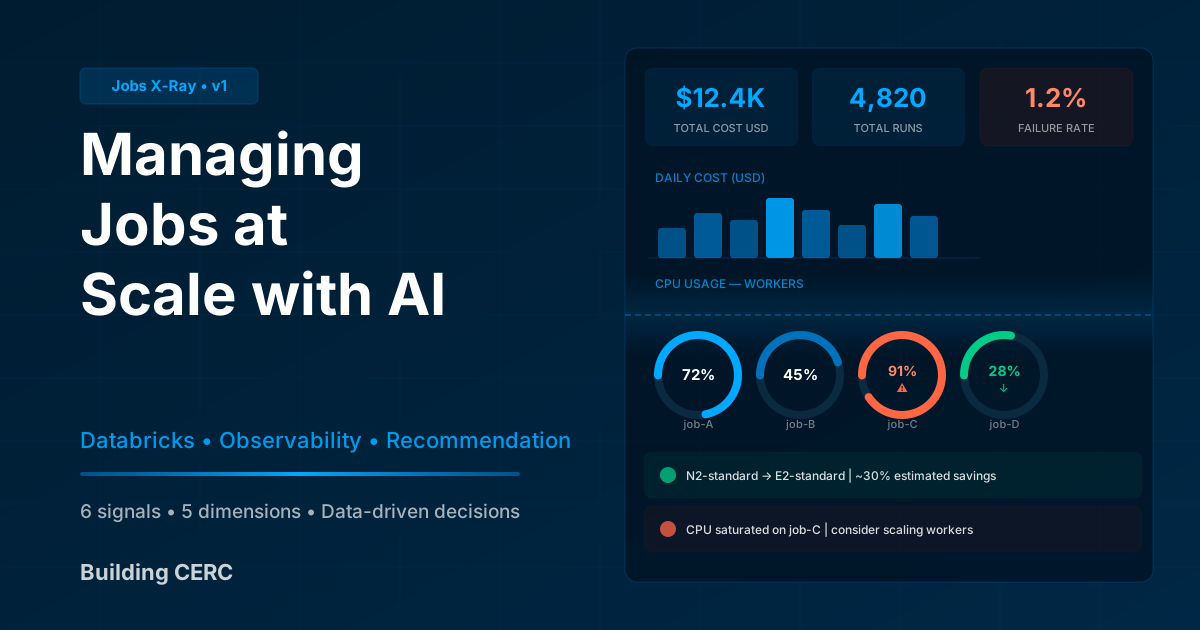
Managing Databricks Jobs at Scale with AI: More Efficiency, Less Guesswork
TL;DR — At CERC, dozens of engineers create and evolve Databricks jobs. That created a clear problem: too much telemetry, too few decisions. We built Jobs X-Ray to unify cost, performance, resources, and failures into a single view. We added a cluster recommendation engine driven by practical, data-oriented rules. The result: a team that investigates less after the problem and acts more before it appears.
CERC operates the financial market infrastructure for receivables registration. Our data platform sustains high-scale operations with regulatory requirements and direct business impact. When jobs fail, the cost does not stay in the cloud bill — it hits operations and engineering time.
Managing Databricks jobs at scale demands more than dashboards full of metrics. It requires a reliable signal, operational rules, and data-driven recommendations. In this article, we explain how we built Jobs X-Ray: what we unified, how we changed squad routines, and what cluster recommendation engine we used to reduce cost without sacrificing reliability.
The problem that grew with the team
When an operation scales, almost every data team goes through the same phase: too much information, too little clarity. Our complexity grew on two fronts simultaneously — the data engineering team grew, and other areas also started creating and evolving jobs. What was once the work of a few became the daily routine of dozens of people.
That was great for velocity, but it brought a new challenge for technical governance. The data was there; the work was assembling too many pieces to answer basic questions. Which job is expensive without delivering proportional value? Which bottleneck comes from code, and which from the cluster? Which configuration makes sense for this job now — not for the monthly average?
The turning point
At the monthly demo, a central point came up: we did not lack dashboards — we lacked decisions grounded in reliable signals. That became the goal of Jobs X-Ray: move from reactive observation to continuous operational management, giving engineers better tools to decide before cost appears.
What Jobs X-Ray unified in job management
The first version brought five dimensions of observability into a single view:
- Cost per job in DBU and USD.
- Run duration, state, and frequency.
- Execution metrics: spill, shuffle, cache, and I/O.
- CPU, memory, and network usage per task.
- Duration outliers and failure patterns.
This design reduced triage time and improved the quality of technical conversations. It also created a shared baseline so different teams could make decisions using the same criteria. When dozens of people create jobs, a shared standard becomes a requirement — not a detail.
What changed in squad day-to-day
The main change was routine. Before, the team investigated after the critical alert. Now, they work through a five-step funnel:
- Overview for a quick workspace health read.
- Cost Analysis when there is budget pressure.
- Performance and I/O for latency diagnosis.
- Failures and Outliers for instability analysis.
- Resource Workers and Driver for cluster sizing.
This order sounds simple, but it prevents deep analysis without a clear hypothesis. The conversation moves from individual opinion to standardized operational reading — a key point for reducing asymmetry between teams with different levels of Spark and Databricks experience.
Real scale: a nearly unlimited decision space
As jobs grow, so does the decision space: cluster family, machine size, memory profile, number of workers, storage strategy, and execution pattern. In practice, the possible combinations are nearly unlimited.
Jobs have seasonality. A job that runs comfortably on normal days can saturate during month-end closing, regulatory windows, or other peak periods — and the reverse also happens: an over-provisioned job during low-volume periods. Without continuous pattern reading, the team oscillates between expensive overprovisioning and unstable underprovisioning.
Six signals to turn telemetry into job diagnostics
Telemetry only becomes management when operational rules exist. The six most useful rules in this phase:
- High spill signals memory pressure.
- High shuffle signals poor processing distribution.
- Low cache hit signals an opportunity to optimize data reuse.
- Low pruning signals a filter or data model that needs review.
- SWAP above 5% indicates potential degradation.
- High CPU difference between workers indicates data skew.
With these signals, the discussion moves from guesswork to diagnosis. This same model guided the BigQuery migration and operations optimization at CERC, with a 40% cost reduction after systematic application of operational rules.
A grounded cluster recommendation engine
The cluster recommendation layer was the most important step in V1. It crosses four factors: average CPU utilization, the machine family in use, compatibility with the GCP/Databricks environment, and saturation risk. Practical output examples:
- Low CPU on an expensive family: suggest a more economical family, with an estimated ~30% saving.
- High CPU near saturation: suggest increasing capacity or adding workers.
- Stable utilization: keep the current configuration.
Savings estimates are not absolute truths: the recommendation generates a hypothesis, and the real gain must be measured by comparing before and after. This is where AI and pattern detection come in with force — our goal is not just to explain what already happened, but to act before a sizing mistake becomes cost or an incident.
An analogy helps: AI works like a supermarket shelf curation. There is a huge shelf of possible options, but the recommendation must point to the right offer for that context, that moment, and that consumption profile. In our case, consumption is job behavior; the offer is the configuration that balances cost, performance, and operational risk.
Outlier as a risk signal
We started treating duration outside the expected range as operational risk, not curiosity. Statistical detection using quartiles — IQR (Interquartile Range) × 1.5 — separates normal variation from real anomalies. When a run falls outside the expected range, the investigation starts with both technical and business context. This approach reduces surprise during critical windows and improves planning for seasonality, turning historical variation into input for preventive decisions.
The broader AI journey at CERC
This article is not just about a dashboard. It is part of a broader journey: we are combining observability, automation, and agents to make better decisions with less noise. You can see how this same principle applies in orchestrating Databricks workflows with Apache Airflow and in data ingestion at scale with a declarative stack.
In the same cycle, we advanced structural efficiency on the data platform. One example is the migration of the raw layer to a more efficient storage policy, with an expected 70–80% cost reduction in that area. The logic is the same: improve cost without losing reliability, improve velocity without losing governance, improve scale without increasing fragility.
What comes in the next version
The next steps are already clear:
- Give more weight to memory in the recommendation engine.
- Close the loop: measure observed savings after a change is applied.
- Integrate recommendations with technical backlog prioritization.
- Incorporate seasonality as a recommendation factor.
- Create preventive deviation alerts before critical windows.
The goal is to move from “I think it improved” to “I proved it improved.” If you are structuring Databricks job observability and want to exchange experiences with our team, check out open opportunities at CERC.